Making Sense of Curves: Drawing Tangents and Normals with Diagrams Library
Drawing tangent and normal vectors on curves helps understand how curves behave. The Diagrams library in Haskell makes this easy. Based on Pontus Granström’s example, here’s how to do it.
First, import the libraries:
import Diagrams.Backend.SVG.CmdLine
import Diagrams.Prelude
Define your points and create a smooth curve:
pts = map p2 [(0,0), (1,1), (2,1), (3,0), (3.5,0)]

spline :: Located (Trail V2 Double)
spline = cubicSpline False pts
Pick a point on the curve and get its vectors:
param = 0.45
pt = atParam spline param
tangentVector = tangentAtParam spline param
normalVector = normalAtParam spline param
Create the visual elements - lines for vectors and a square for the right angle:
symmetricLine v = fromOffsets [2 *^ v] # center
tangentLine = symmetricLine tangentVector
normalLine = symmetricLine normalVector

rightAngleSquare = square 0.1 # alignBL # rotate (signedAngleBetween tangentVector unitX)
Finally, put everything together:
example :: Diagram B
example = frame 0.5 $
  strokeLocTrail spline
  <> mconcat
     [ tangentLine
     , baselineText "tangent" # translate tangentVector
     , normalLine
     , topLeftText "normal" # translate normalVector
     , rightAngleSquare
     ] # moveTo pt # fontSize large
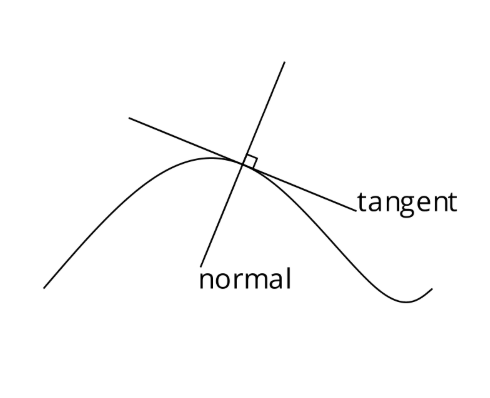
A tangent vector shows which way the curve is pointing at any point. The normal vector sits at a right angle to the tangent, pointing away from the curve. We use a parameter - just a number - to tell us exactly where we are along the curve.
Seeing math as pictures makes it much easier to understand than staring at equations. You can quickly check if your calculations are right by looking at the visual result. This builds intuition faster than pure algebra.
You could animate the vectors to show how they change as you move along the curve. Another idea is to display vectors at several points at once. You might also add curvature circles to show how sharply the curve bends.
Check out the Diagrams docs for more examples. The original example by Pontus Granström shows this code in action. Learn more about Haskell to write your own diagrams.
Simple code for drawing tangent and normal vectors on curves using Haskell’s Diagrams library.